Multiple Choice
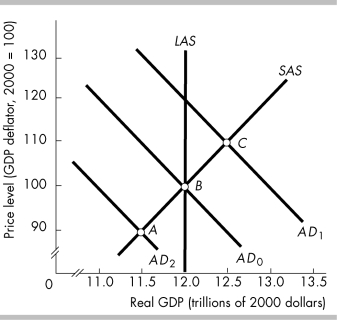
-In the above figure, point A represents
A) a full- employment equilibrium.
B) an increase in aggregate demand.
C) a recessionary gap.
D) an inflationary gap.
Correct Answer:

Verified
Correct Answer:
Verified
Related Questions
Q105: The SAS curve shifts if there is
Q106: A change in the full- employment quantity
Q107: <img src="https://d2lvgg3v3hfg70.cloudfront.net/TB5270/.jpg" alt=" -The data in
Q108: A rise in the expected future inflation
Q109: In 2008, Japan's economy suffered as world
Q112: Aggregate supply is<br>A) the relationship between the
Q113: Substitution effects help explain the slope of
Q114: If you are have $1,000 of money
Q115: <img src="https://d2lvgg3v3hfg70.cloudfront.net/TB5270/.jpg" alt=" -Suppose the economy
Q312: Explain the relationship of the long-run aggregate