Multiple Choice
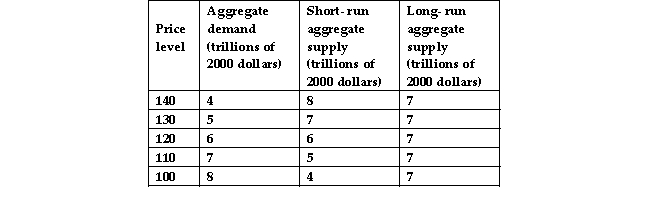
-The data in the above table show that the economy will be in a short- run macroeconomic equilibrium at a price level of
A) 100.
B) 120.
C) 90.
D) 110.
Correct Answer:

Verified
Correct Answer:
Verified
Related Questions
Q102: <img src="https://d2lvgg3v3hfg70.cloudfront.net/TB5270/.jpg" alt=" -The data in
Q103: The long- run aggregate supply curve<br>A) is
Q104: The AD curve shows the sum of<br>A)
Q105: The SAS curve shifts if there is
Q106: A change in the full- employment quantity
Q108: A rise in the expected future inflation
Q109: In 2008, Japan's economy suffered as world
Q110: <img src="https://d2lvgg3v3hfg70.cloudfront.net/TB5270/.jpg" alt=" -In the above
Q112: Aggregate supply is<br>A) the relationship between the
Q312: Explain the relationship of the long-run aggregate