Multiple Choice
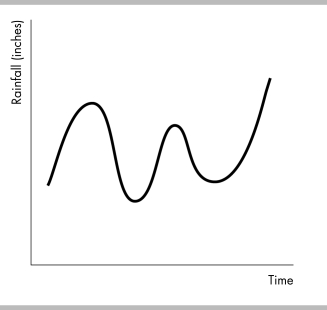
-The figure above shows a
A) scatter diagram.
B) regression.
C) time- series graph.
D) two- variable time- series graph.
Correct Answer:

Verified
Correct Answer:
Verified
Related Questions
Q292: An analyst on a local news channel
Q375: "As interest rates fall, people spend more."
Q376: You have the choice of going on
Q377: Scarcity is experienced by<br>A) only the poor.<br>B)
Q378: On the horizontal axis of a graph,
Q379: Opportunity cost is best defined as<br>A) how
Q381: The fact that a rock star earns
Q382: <img src="https://d2lvgg3v3hfg70.cloudfront.net/TB5270/.jpg" alt=" -In the above
Q384: An autoworker is an example of _
Q390: "It is impossible to represent a three