Multiple Choice
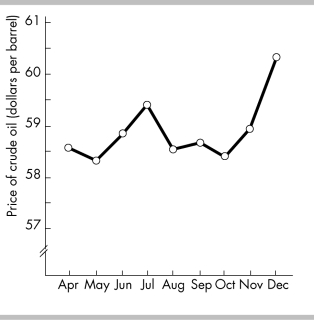
-Using the above figure, during which of the following periods does the price of crude oil have a downward trend?
A) May to July
B) October to December
C) May to November
D) July to October
Correct Answer:

Verified
Correct Answer:
Verified
Q225: The slope of a line is the
Q343: In economics we learn that<br>A) sometimes there
Q344: Using the information in the table above,
Q347: Suppose you produce 10 bikes a day
Q348: Which type of graph is used to
Q350: <img src="https://d2lvgg3v3hfg70.cloudfront.net/TB5270/.jpg" alt=" -In the figure
Q351: <img src="https://d2lvgg3v3hfg70.cloudfront.net/TB5270/.jpg" alt=" -The above figure
Q406: To calculate the slope of a curved
Q415: <img src="https://d2lvgg3v3hfg70.cloudfront.net/TB6802/.jpg" alt=" -The slope of
Q422: <img src="https://d2lvgg3v3hfg70.cloudfront.net/TB8586/.jpg" alt=" -In the above,