Multiple Choice
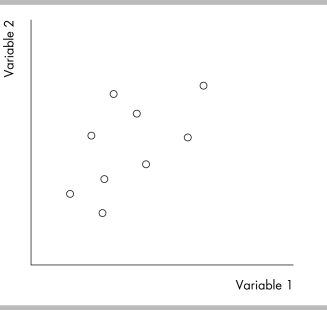
-The above figure is
A) a scatter diagram showing that there is no clear relationship between unemployment and inflation.
B) an economic model showing that when unemployment falls, inflation rises.
C) a time- series graph showing that when unemployment rises, so too does inflation.
D) a cross- section graph showing that when unemployment falls, so too does inflation.
Correct Answer:

Verified
Correct Answer:
Verified
Q76: <img src="https://d2lvgg3v3hfg70.cloudfront.net/TB6802/.jpg" alt=" -The above figure
Q172: Explain whether the statement, ʺHillary Clinton was
Q346: <img src="https://d2lvgg3v3hfg70.cloudfront.net/TB5270/.jpg" alt=" -Using the above
Q347: Suppose you produce 10 bikes a day
Q348: Which type of graph is used to
Q350: <img src="https://d2lvgg3v3hfg70.cloudfront.net/TB5270/.jpg" alt=" -In the figure
Q353: A country using mainly labor to build
Q354: One economist says that raising taxes on
Q356: A cross- section graph shows the value
Q415: <img src="https://d2lvgg3v3hfg70.cloudfront.net/TB6802/.jpg" alt=" -The slope of