Multiple Choice
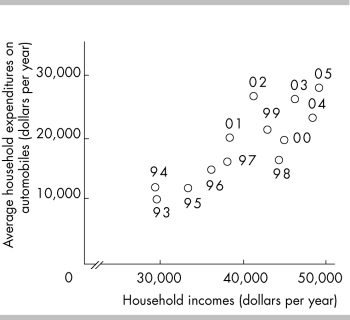
-The above figure is a
A) time- series graph.
B) cross- section graph.
C) scatter diagram.
D) None of the above answers is correct.
Correct Answer:

Verified
Correct Answer:
Verified
Related Questions
Q154: A graph shows that as fees to
Q188: Scarcity applies to both the rich and
Q203: <img src="https://d2lvgg3v3hfg70.cloudfront.net/TB6802/.jpg" alt=" -The slope of
Q401: In terms of dollars, the marginal benefit
Q402: A trend is<br>A) the maximum value of
Q405: If we use the numbers in the
Q408: The slope of a straight line is
Q411: Trend refers to<br>A) decreases but not increases
Q424: If the change in the y-axis variable
Q453: Your friend is preparing for this exam