Multiple Choice
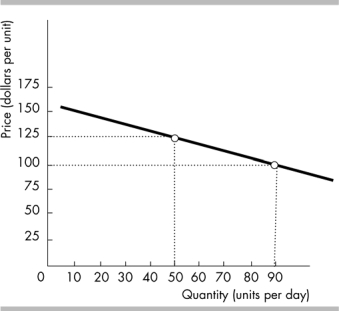
-The slope of the line shown in the above figure is
A) 5/8.
B) -0.625.
C) -1 3/8.
D) -1 2/3.
Correct Answer:

Verified
Correct Answer:
Verified
Q198: On a graph, high correlation between the
Q199: A benefit from an increase in activity
Q200: <img src="https://d2lvgg3v3hfg70.cloudfront.net/TB6802/.jpg" alt=" -The slope of
Q201: On a graph showing the relationship between
Q202: <img src="https://d2lvgg3v3hfg70.cloudfront.net/TB6802/.jpg" alt=" -In the above
Q205: A store remains open from 8 a.m.
Q206: <img src="https://d2lvgg3v3hfg70.cloudfront.net/TB6802/.jpg" alt=" -In the above
Q207: <img src="https://d2lvgg3v3hfg70.cloudfront.net/TB6802/.jpg" alt=" -Which of the
Q208: The statement ʺThe unemployment rate for teens
Q233: <img src="https://d2lvgg3v3hfg70.cloudfront.net/TB8586/.jpg" alt=" -In the figure