Essay
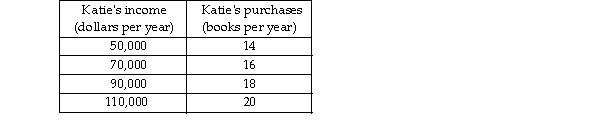
-The table above shows how the number of books Katie buys each year depends on her income.
a) What kind of relationship exists between Katie's income and the number of books she purchases?
b) Plot the relationship between Katie's income and the number of books she purchases in the above figure. Me income along the vertical axis and the number of books along the horizontal axis. Be sure to label the axes.
c) What is the slope of the relationship between $50,000 and $70,000 of income?
d) What is the slope of the relationship between $90,000 and $110,000 of income?
e) Comment on the similarity or dissimilarity of your answers to parts (c) and (d).
Correct Answer:

Verified
a) There is a positive relationship. Whe...View Answer
Unlock this answer now
Get Access to more Verified Answers free of charge
Correct Answer:
Verified
View Answer
Unlock this answer now
Get Access to more Verified Answers free of charge
Q20: <img src="https://d2lvgg3v3hfg70.cloudfront.net/TB8586/.jpg" alt=" -In the above
Q388: If the change in the y-axis variable
Q486: A graph shows the price of a
Q488: <img src="https://d2lvgg3v3hfg70.cloudfront.net/TB5270/.jpg" alt=" -In the above
Q489: In which of the following cases is
Q490: On a graph showing the relationship between
Q492: Which of the following is NOT an
Q493: Which of the following is a normative
Q494: Which of the following is TRUE regarding
Q495: When a firm decides to produce more