Multiple Choice
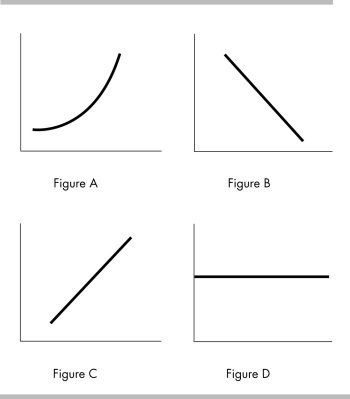
-In the above figure, a negative relationship is demonstrated in which of the graphs?
A) Figure A
B) Figure B
C) Figure C
D) Figure D
Correct Answer:

Verified
Correct Answer:
Verified
Related Questions
Q15: The loss of the highest-valued alternative defines
Q16: From 8 P.M. to 10 P.M., Susan
Q17: When graphed, variables that are unrelated are
Q18: What is the difference between microeconomics and
Q19: <img src="https://d2lvgg3v3hfg70.cloudfront.net/TB8586/.jpg" alt=" -Graphing the data
Q21: Which of the following is a microeconomic
Q22: If two variables are unrelated, a scatter
Q23: Factors of production include all of the
Q24: <img src="https://d2lvgg3v3hfg70.cloudfront.net/TB8586/.jpg" alt=" -In the above
Q25: A scatter diagram will be most useful<br>A)