Multiple Choice
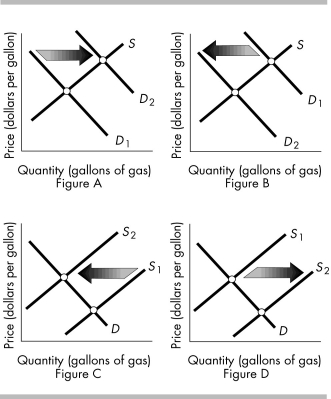
-The above figures show the market for gasoline. Which figure shows the effect of motorists increasing the number of times they take the bus to work rather than driving their own cars?
A) Figure A
B) Figure B
C) Figure C
D) Figure D
Correct Answer:

Verified
Correct Answer:
Verified
Q36: <img src="https://d2lvgg3v3hfg70.cloudfront.net/TB8586/.jpg" alt=" -The figure above
Q37: Sweatshirts and tee-shirts are complements in consumption
Q38: <img src="https://d2lvgg3v3hfg70.cloudfront.net/TB8586/.jpg" alt=" -The above figures
Q39: Which of the following shifts the demand
Q40: When demand increases, the equilibrium price _
Q42: A relative price is the<br>A) slope of
Q43: The "law of demand" predicts that, other
Q44: If the money price of hats rises
Q45: <img src="https://d2lvgg3v3hfg70.cloudfront.net/TB8586/.jpg" alt=" -Consider the demand
Q46: When a market is in equilibrium<br>A) everyone