Multiple Choice
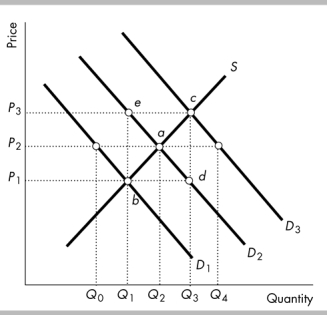
-In the above figure, if D2 is the original demand curve and the population falls, which price and quantity might result?
A) point a, with price P2 and quantity Q2
B) point b, with price P1 and quantity Q1
C) point c, with price P3 and quantity Q3
D) point d, with price P1 and quantity Q3
Correct Answer:

Verified
Correct Answer:
Verified
Q56: <span class="ql-formula" data-value="\begin{array} { | c |
Q76: <img src="https://d2lvgg3v3hfg70.cloudfront.net/TB8586/.jpg" alt=" -The above figure
Q337: Changes in which of the following shifts
Q338: During the past twenty years, the prices
Q340: If the U.S. Surgeon General announced that
Q341: Some sales managers are talking shop. Which
Q342: Suppose the equilibrium price of bottled water
Q343: <img src="https://d2lvgg3v3hfg70.cloudfront.net/TB6802/.jpg" alt=" -The figure above
Q344: <img src="https://d2lvgg3v3hfg70.cloudfront.net/TB6802/.jpg" alt=" -The figure above
Q442: <img src="https://d2lvgg3v3hfg70.cloudfront.net/TB8586/.jpg" alt=" -The above figures