Multiple Choice
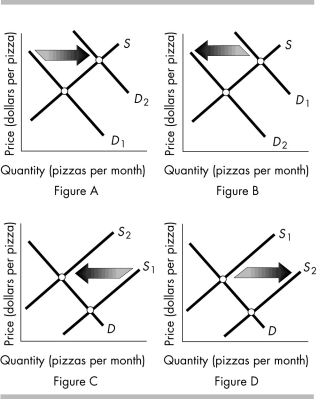
-The above figure shows the market for pizza. Which figure shows the effect of an increase in the price of a complement such as soda?
A) Figure A
B) Figure B
C) Figure C
D) Figure D
Correct Answer:

Verified
Correct Answer:
Verified
Q71: You observe that in the market for
Q72: <img src="https://d2lvgg3v3hfg70.cloudfront.net/TB8586/.jpg" alt=" -The above figures
Q73: <img src="https://d2lvgg3v3hfg70.cloudfront.net/TB8586/.jpg" alt=" -A market research
Q74: <img src="https://d2lvgg3v3hfg70.cloudfront.net/TB8586/.jpg" alt=" -The above table
Q75: <img src="https://d2lvgg3v3hfg70.cloudfront.net/TB8586/.jpg" alt=" -The figure above
Q77: If macaroni and cheese is an inferior
Q78: The price of a bag of corn
Q79: Which of the following increases the supply
Q80: When graphing a demand curve for corn,
Q81: If the price of chocolate chip cookies