Multiple Choice
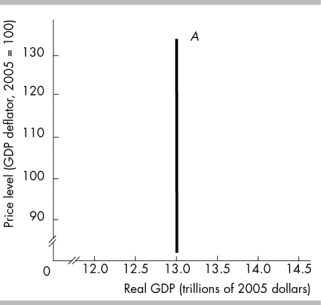
-The curve labeled A in the above figure is a
A) long-run aggregate supply curve.
B) short-run aggregate supply curve.
C) long-run aggregate demand curve.
D) short-run aggregate demand curve.
Correct Answer:

Verified
Correct Answer:
Verified
Q119: <img src="https://d2lvgg3v3hfg70.cloudfront.net/TB6802/.jpg" alt=" -In the above
Q120: An individual holds $10,000 in a checking
Q122: If the economy is in long run
Q123: Which of the following can be said
Q125: Which of the following statements is INCORRECT?<br>A)
Q126: <span class="ql-formula" data-value="\begin{array} { | l |
Q127: Other things constant, the economyʹs aggregate demand
Q129: Your real wealth is measured as the<br>A)
Q161: The long-run aggregate supply curve is upward
Q393: <img src="https://d2lvgg3v3hfg70.cloudfront.net/TB8586/.jpg" alt=" -In the above