Multiple Choice
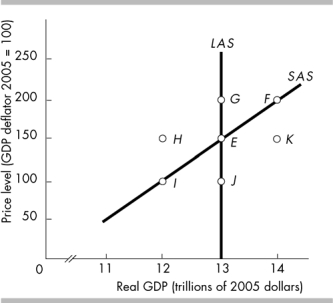
-In the above figure, which movement illustrates the impact of a rising price level and a constant money wage rate?
A) E to F
B) E to I
C) E to G
D) E to K
Correct Answer:

Verified
Correct Answer:
Verified
Related Questions
Q114: Economic growth in India has averaged about
Q117: Over time in a growing economy, the
Q118: Business cycles are the result of<br>A) irregular
Q120: An individual holds $10,000 in a checking
Q122: If the economy is in long run
Q123: Which of the following can be said
Q124: <img src="https://d2lvgg3v3hfg70.cloudfront.net/TB6802/.jpg" alt=" -The curve labeled
Q134: The quantity of real GDP demanded equals
Q195: If the money prices of resources changes,
Q393: <img src="https://d2lvgg3v3hfg70.cloudfront.net/TB8586/.jpg" alt=" -In the above