Multiple Choice
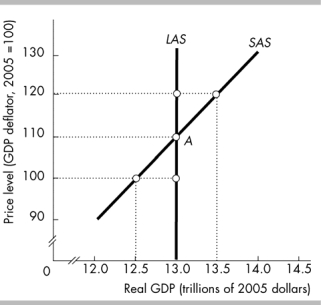
-In the figure above, potential GDP equals
A) $13.5 trillion.
B) $13.0 trillion.
C) $12.5 trillion.
D) None of the above answers is correct.
Correct Answer:

Verified
Correct Answer:
Verified
Q115: <img src="https://d2lvgg3v3hfg70.cloudfront.net/TB8586/.jpg" alt=" -In the above
Q281: Assume the equilibrium price level is 140
Q354: <img src="https://d2lvgg3v3hfg70.cloudfront.net/TB6802/.jpg" alt=" -In the above
Q355: Which of the following shifts the short-run
Q356: In the long-run equilibrium, an increase in
Q358: If you have $1,000 in wealth and
Q359: The Great Depression, in which real GDP
Q360: <img src="https://d2lvgg3v3hfg70.cloudfront.net/TB6802/.jpg" alt=" -The curve labeled
Q361: For movements along the long-run aggregate supply
Q362: For movements along the short-run aggregate supply