Multiple Choice
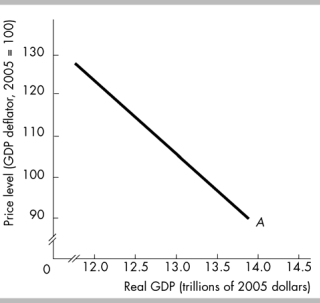
-The curve labeled A in the above figure is
A) an aggregate demand curve.
B) a short-run aggregate supply curve.
C) a production possibilities curve.
D) a long-run aggregate supply curve.
Correct Answer:

Verified
Correct Answer:
Verified
Q355: Which of the following shifts the short-run
Q356: In the long-run equilibrium, an increase in
Q357: <img src="https://d2lvgg3v3hfg70.cloudfront.net/TB6802/.jpg" alt=" -In the figure
Q358: If you have $1,000 in wealth and
Q359: The Great Depression, in which real GDP
Q361: For movements along the long-run aggregate supply
Q362: For movements along the short-run aggregate supply
Q363: <span class="ql-formula" data-value="\begin{array} { | l |
Q364: We distinguish between the long-run aggregate supply
Q365: The short-run aggregate supply curve_<br>A) illustrates the