Multiple Choice
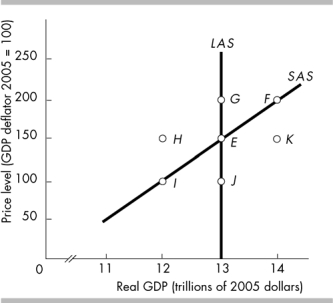
-In the above figure, which movement illustrates the impact of the price level and money wage rate falling at the same rate?
A) E to H
B) E to J
C) E to G
D) E to K
Correct Answer:

Verified
Correct Answer:
Verified
Q10: <img src="https://d2lvgg3v3hfg70.cloudfront.net/TB8586/.jpg" alt=" -In the above
Q144: In the short-run<br>A) the price level does
Q145: As world economies start to recover from
Q147: The aggregate demand curve<br>A) shifts rightward when
Q150: A below full-employment equilibrium<br>A) occurs when the
Q151: Economic growth is best defined as<br>A) rightward
Q152: Which of the following does NOT shift
Q153: The aggregate demand curve shows the_ relationship
Q154: The aggregate demand curve shows<br>A) the quantity
Q387: Fluctuations in aggregate demand and aggregate supply