Multiple Choice
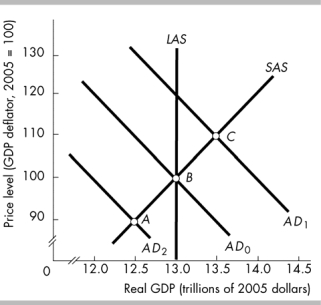
-In the above figure, point A represents
A) an increase in aggregate demand.
B) a recessionary gap.
C) an inflationary gap.
D) a full-employment equilibrium.
Correct Answer:

Verified
Correct Answer:
Verified
Q84: A decrease in the price level accompanied
Q85: <img src="https://d2lvgg3v3hfg70.cloudfront.net/TB6802/.jpg" alt=" -In the figure
Q86: In recent years, Japanʹs capital stock has
Q87: <img src="https://d2lvgg3v3hfg70.cloudfront.net/TB6802/.jpg" alt=" -In the above
Q88: <img src="https://d2lvgg3v3hfg70.cloudfront.net/TB6802/.jpg" alt=" -In the above
Q90: <img src="https://d2lvgg3v3hfg70.cloudfront.net/TB6802/.jpg" alt=" -In the above
Q91: Moving along the short-run aggregate supply curve,_<br>A)
Q92: An increase in aggregate demand is shown
Q93: <img src="https://d2lvgg3v3hfg70.cloudfront.net/TB6802/.jpg" alt=" -The above figure
Q94: According to the intertemporal substitution effect, when