Multiple Choice
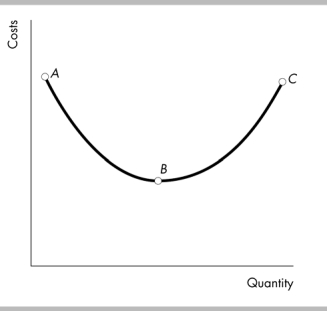
-In the above figure, the relationship between costs and quantity is negative
A) between point A and point B.
B) along the entire curve.
C) no where along the curve.
D) between point B and point C.
Correct Answer:

Verified
Correct Answer:
Verified
Q37: Economics is best defined as the study
Q38: <img src="https://d2lvgg3v3hfg70.cloudfront.net/TB6802/.jpg" alt=" -In the above
Q39: People must make choices because<br>A) there are
Q40: <img src="https://d2lvgg3v3hfg70.cloudfront.net/TB6802/.jpg" alt=" -The slope of
Q41: Suppose that you are spending two hours
Q43: A scatter diagram shows the<br>A) evolution of
Q44: Bill Bonecrusher graduates from college with a
Q45: The loss of the highest-valued alternative defines
Q46: Positive economic statements<br>A) prescribe what should be.<br>B)
Q49: <img src="https://d2lvgg3v3hfg70.cloudfront.net/TB8586/.jpg" alt=" -In the above,