Multiple Choice
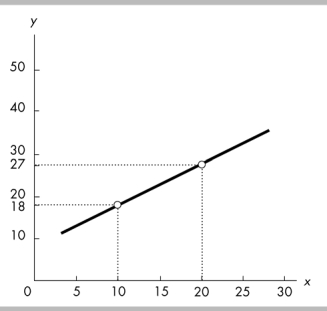
-The slope of the line shown in the above figure is
A) 2.
B) 0.90.
C) 1.5.
D) 1.11.
Correct Answer:

Verified
Correct Answer:
Verified
Related Questions
Q35: On a graph, an upward-sloping curve that
Q36: The vertical axis in a graph<br>A) is
Q37: Economics is best defined as the study
Q38: <img src="https://d2lvgg3v3hfg70.cloudfront.net/TB6802/.jpg" alt=" -In the above
Q39: People must make choices because<br>A) there are
Q41: Suppose that you are spending two hours
Q42: <img src="https://d2lvgg3v3hfg70.cloudfront.net/TB6802/.jpg" alt=" -In the above
Q43: A scatter diagram shows the<br>A) evolution of
Q44: Bill Bonecrusher graduates from college with a
Q45: The loss of the highest-valued alternative defines