Multiple Choice
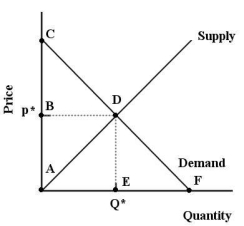 FIGURE 6-6
-Refer to Figure 6-6.Suppose the market price is p*.In this case,consumer surplus is outlined by the area
A) ACDE.
B) ABDF.
C) ACF.
D) BCD.
E) ADE.
Correct Answer:

Verified
Correct Answer:
Verified
Q130: <img src="https://d2lvgg3v3hfg70.cloudfront.net/TB5441/.jpg" alt=" FIGURE 6-4 -Refer
Q131: <img src="https://d2lvgg3v3hfg70.cloudfront.net/TB5441/.jpg" alt=" FIGURE 6-9 -Refer
Q132: <img src="https://d2lvgg3v3hfg70.cloudfront.net/TB5441/.jpg" alt=" FIGURE 6-1 -Refer
Q133: The substitution effect is<br>A)the change in quantity
Q134: Given a particular consumer's indifference map,the further
Q135: Since there is a relatively plentiful supply
Q136: The diagram below shows a set of
Q137: The table below shows the total value
Q138: <img src="https://d2lvgg3v3hfg70.cloudfront.net/TB5441/.jpg" alt=" FIGURE 6-2 -Refer
Q139: Bjorn is a student with a monthly