Multiple Choice
The diagram below shows a set of budget lines facing a household. 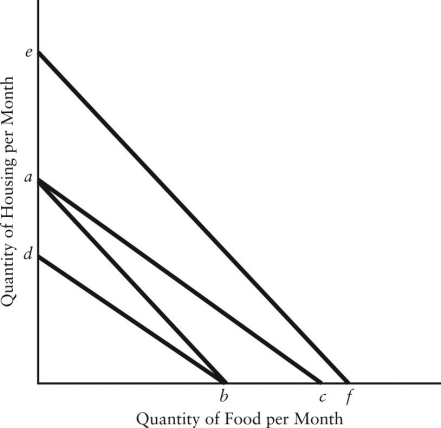 FIGURE 6-8
-Refer to Figure 6-8.The movement of the budget line from ab to ef could be caused by
A) a decrease in money income.
B) a decrease in the price of either food or housing.
C) an equal percentage decrease in the price of both food and housing.
D) an equal percentage increase in the price of both food and housing.
E) an increase in the price of either food or housing.
Correct Answer:

Verified
Correct Answer:
Verified
Q90: <img src="https://d2lvgg3v3hfg70.cloudfront.net/TB5441/.jpg" alt=" FIGURE 6-1 -Refer
Q91: <img src="https://d2lvgg3v3hfg70.cloudfront.net/TB5441/.jpg" alt=" FIGURE 6-9 -Refer
Q92: <img src="https://d2lvgg3v3hfg70.cloudfront.net/TB5441/.jpg" alt=" FIGURE 6-5 -Refer
Q93: If the income effect of a price
Q94: The demand curve for a good with
Q96: The table below shows the quantities of
Q97: Consider the pizza market,with a downward-sloping demand
Q98: At a garage sale,Dominique purchases a sewing
Q99: Assume you are consuming two goods,X and
Q100: 6A-5 Income and Substitution Effects <img src="https://d2lvgg3v3hfg70.cloudfront.net/TB5441/.jpg"