Multiple Choice
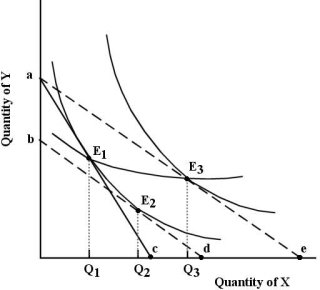 FIGURE 6-11
-Refer to Figure 6-11. Suppose the consumer begins at E 1. The income and substitution effects of the reduction in the price of X are represented as follows:
A) the distance Q1d shows the substitution effect and the distance Q2e shows the income effect.
B) the distance de shows the income effect and the distance cd shows the substitution effect.
C) the distance Q1Q2 shows the income effect and the distance Q2Q3 shows the substitution effect.
D) the distance Q1Q2 shows the substitution effect and the distance Q2Q3 shows the income effect.
E) the distance Q1Q3 shows the substitution effect and the distance Q2Q3 shows the income effect.
Correct Answer:

Verified
Correct Answer:
Verified
Q3: If a consumer is faced with a
Q8: Consider the income and substitution effects of
Q12: Consider the income and substitution effects of
Q17: <img src="https://d2lvgg3v3hfg70.cloudfront.net/TB5441/.jpg" alt=" FIGURE 6-1 -Refer
Q36: <img src="https://d2lvgg3v3hfg70.cloudfront.net/TB5441/.jpg" alt=" FIGURE 6-9 -Refer
Q41: The marginal rate of substitution<br>A)always has a
Q57: <img src="https://d2lvgg3v3hfg70.cloudfront.net/TB5441/.jpg" alt=" FIGURE 6-2 -Refer
Q70: The marginal rate of substitution measures the
Q97: Consider the pizza market,with a downward-sloping demand
Q104: John is allocating his household expenditure between