Multiple Choice
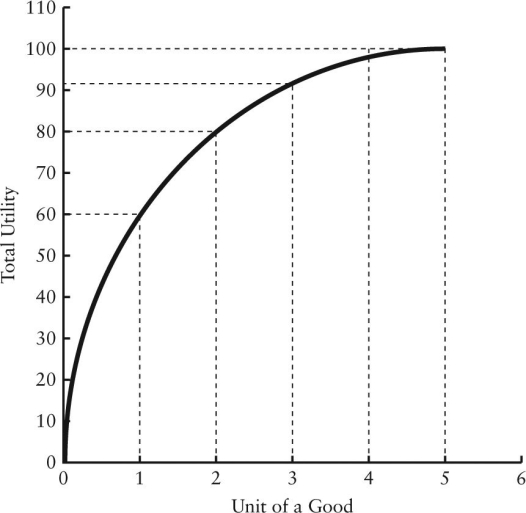 FIGURE 6-1
-Refer to Figure 6-1.This figure illustrates the law of
A) maximizing utility.
B) increasing total utility.
C) diminishing total utility.
D) diminishing marginal utility.
E) increasing marginal utility.
Correct Answer:

Verified
Correct Answer:
Verified
Q12: Consider the income and substitution effects of
Q13: Marginal utility theory is about<br>A)the consumer behaviour
Q14: If total utility from the consumption of
Q15: <img src="https://d2lvgg3v3hfg70.cloudfront.net/TB5441/.jpg" alt=" FIGURE 6-7 -Refer
Q16: In indifference curve analysis,the consumer's utility-maximizing point
Q18: Any consumption point that is on the
Q19: The table below shows the quantities of
Q20: As a consumer moves along an indifference
Q21: If total utility from the consumption of
Q22: Diagrams A,B,and C show 3 individual consumers'