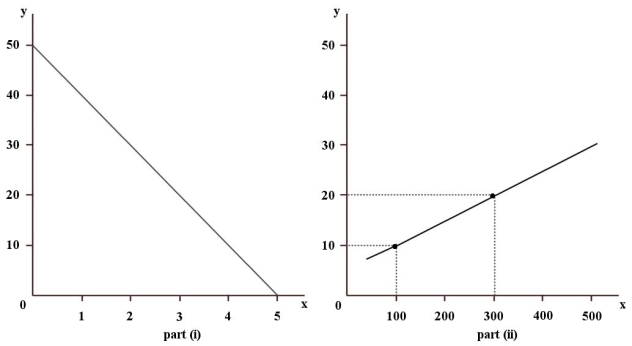
menu-iconExamlexExamLexServices

Discover

Ask a Question
  1. All Topics
  2. Topic
    Business
  3. Study Set
    Economics Study Set 1
  4. Exam
    Exam 2: Economic Theories,Data,and Graphs
  5. Question
    FIGURE 2-1 -Refer to Figure 2-1.What Is the Slope of the Line
Solved

FIGURE 2-1 -Refer to Figure 2-1.What Is the Slope of the Line

Question 134

Question 134

Multiple Choice

  FIGURE 2-1 -Refer to Figure 2-1.What is the slope of the line in part (ii) of the figure? A) 12.5 B) -12.5 C) 1 D) 0.05 E) 0.08 FIGURE 2-1
-Refer to Figure 2-1.What is the slope of the line in part (ii) of the figure?


A) 12.5
B) -12.5
C) 1
D) 0.05
E) 0.08

Correct Answer:

verifed

Verified

Unlock this answer now
Get Access to more Verified Answers free of charge

Related Questions

Q29: When studying economic data,index numbers are especially

Q32: Economics is scientific because<br>A)economists routinely conduct controlled

Q83: The statement "Y is a function of

Q128: When studying economic data,and when comparing the

Q131: The table below shows hypothetical data for

Q133: Data collected repeatedly over successive periods of

Q134: Economists build models that abstract from the

Q137: <img src="https://d2lvgg3v3hfg70.cloudfront.net/TB5441/.jpg" alt=" FIGURE 2-4 -Refer

Q138: The table below shows hypothetical data for

Q139: The table below shows hypothetical prices for

Examlex

ExamLex

About UsContact UsPerks CenterHomeschoolingTest Prep

Work With Us

Campus RepresentativeInfluencers

Links

FaqPricingChrome Extension

Download The App

Get App StoreGet Google Play

Policies

Privacy PolicyTerms of ServiceHonor CodeCommunity Guidelines

Scan To Download

qr-code

Copyright © (2025) ExamLex LLC.

Privacy PolicyTerms Of ServiceHonor CodeCommunity Guidelines