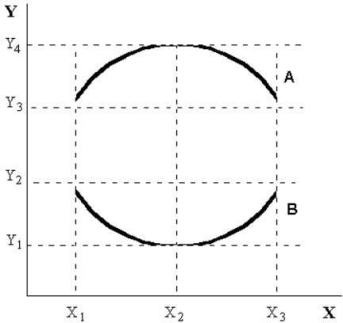
menu-iconExamlexExamLexServices

Discover

Ask a Question
  1. All Topics
  2. Topic
    Business
  3. Study Set
    Macroeconomics Study Set 42
  4. Exam
    Exam 2: Economic Theories, Data, and Graphs
  5. Question
    FIGURE 2-3 -Refer to Figure 2-3. the Slope of Curve a Is
Solved

FIGURE 2-3 -Refer to Figure 2-3. the Slope of Curve a Is

Question 27

Question 27

Multiple Choice

  FIGURE 2-3 -Refer to Figure 2-3. The slope of curve A is A)  zero. B)  negative and variable. C)  positive and variable. D)  positive from X1 to X2 and negative from X2 to X3. E)  negative from X1 to X2 and positive from X2 to X3. FIGURE 2-3
-Refer to Figure 2-3. The slope of curve A is


A) zero.
B) negative and variable.
C) positive and variable.
D) positive from X1 to X2 and negative from X2 to X3.
E) negative from X1 to X2 and positive from X2 to X3.

Correct Answer:

verifed

Verified

Unlock this answer now
Get Access to more Verified Answers free of charge

Related Questions

Q2: The table below shows hypothetical data for

Q3: The table below shows hypothetical tuition costs

Q10: Figure 2-5 shows monthly average (per unit)production

Q29: When studying economic data,index numbers are especially

Q31: <img src="https://d2lvgg3v3hfg70.cloudfront.net/TB7542/.jpg" alt=" FIGURE 2-1 -On

Q40: The table below shows hypothetical tuition costs

Q43: Choose the answer that best explains why

Q51: The table below shows the approximate value

Q108: <img src="https://d2lvgg3v3hfg70.cloudfront.net/TB5441/.jpg" alt=" FIGURE 2-4 -Refer

Q111: The table below shows hypothetical data for

Examlex

ExamLex

About UsContact UsPerks CenterHomeschoolingTest Prep

Work With Us

Campus RepresentativeInfluencers

Links

FaqPricingChrome Extension

Download The App

Get App StoreGet Google Play

Policies

Privacy PolicyTerms of ServiceHonor CodeCommunity Guidelines

Scan To Download

qr-code

Copyright © (2025) ExamLex LLC.

Privacy PolicyTerms Of ServiceHonor CodeCommunity Guidelines