Multiple Choice
The table below shows hypothetical data for the volume of gold and nickel output across several years.
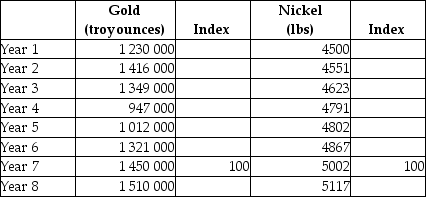 TABLE 2-6
-Refer to Table 2-6.What is the percentage change in gold output from Year 1 to Year 7?
A) 17.9%
B) 84.8%
C) 15.2%
D) -15.2%
E) 0.152%
Correct Answer:

Verified
Correct Answer:
Verified
Q1: The table below shows the approximate value
Q3: The table below shows hypothetical tuition costs
Q6: The table below shows hypothetical per-minute cell
Q7: The table below shows the approximate value
Q10: Figure 2-5 shows monthly average (per unit)production
Q11: The table below shows hypothetical prices for
Q27: On a coordinate graph with y on
Q66: Which of the following is a normative
Q116: Which is the best description of positive
Q144: Choose the statement that best characterizes an