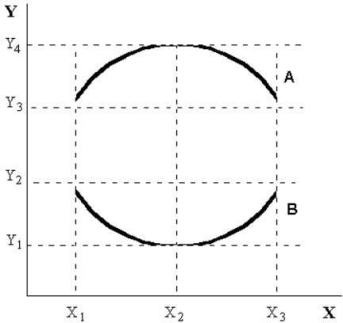
menu-iconExamlexExamLexServices

Discover

Ask a Question
  1. All Topics
  2. Topic
    Business
  3. Study Set
    Macroeconomics Study Set 42
  4. Exam
    Exam 2: Economic Theories, Data, and Graphs
  5. Question
    FIGURE 2-3 -Refer to Figure 2-3. at X2 on Curve A, the A
Solved

FIGURE 2-3 -Refer to Figure 2-3. at X2 on Curve A, the A

Question 123

Question 123

Multiple Choice

  FIGURE 2-3 -Refer to Figure 2-3. At X2 on curve A, the A)  maximum occurs at Y1. B)  minimum occurs at Y4. C)  slope of the curve is zero. D)  slope is increasing. E)  slope is decreasing. FIGURE 2-3
-Refer to Figure 2-3. At X2 on curve A, the


A) maximum occurs at Y1.
B) minimum occurs at Y4.
C) slope of the curve is zero.
D) slope is increasing.
E) slope is decreasing.

Correct Answer:

verifed

Verified

Unlock this answer now
Get Access to more Verified Answers free of charge

Related Questions

Q29: Figure 2-5 shows monthly average (per unit)production

Q38: Which of the following is a normative

Q57: In a co-ordinate graph,with Y on the

Q68: <img src="https://d2lvgg3v3hfg70.cloudfront.net/TB5441/.jpg" alt=" FIGURE 2-4 -Refer

Q76: The table below shows hypothetical data for

Q81: The slope of a straight line is

Q84: On a coordinate graph with y on

Q125: Suppose an economist tells you that, on

Q131: A scatter diagram<br>A)is a graph of a

Q140: The table below shows hypothetical data for

Examlex

ExamLex

About UsContact UsPerks CenterHomeschoolingTest Prep

Work With Us

Campus RepresentativeInfluencers

Links

FaqPricingChrome Extension

Download The App

Get App StoreGet Google Play

Policies

Privacy PolicyTerms of ServiceHonor CodeCommunity Guidelines

Scan To Download

qr-code

Copyright © (2025) ExamLex LLC.

Privacy PolicyTerms Of ServiceHonor CodeCommunity Guidelines