Multiple Choice
Figure 2-5 shows monthly average (per unit) production costs for producing Good X. 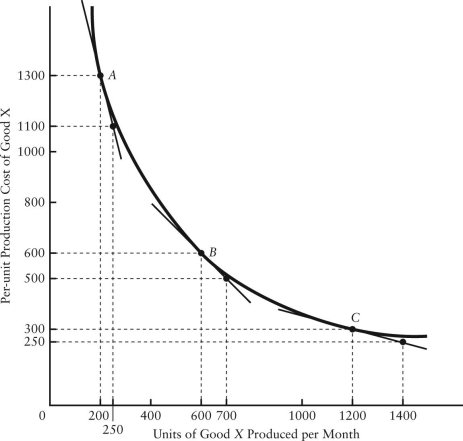 FIGURE 2-5
-Refer to Figure 2-5.What is the slope of this non-linear function when 200 units per month are being produced?
A) 4
B) -4
C) 0.25
D) -5.2
E) -0.25
Correct Answer:

Verified
Correct Answer:
Verified
Related Questions
Q43: Choose the answer that best explains why
Q53: Most economists believe that economic analysis _
Q71: According to the Bank of Canada's website,Canada's
Q73: Suppose economists at the World Bank develop
Q75: Let 1 stand for "any given period"
Q76: The table below shows hypothetical data for
Q79: On a coordinate graph with y on
Q84: On a coordinate graph with y on
Q114: Suppose we observe that consumption of electricity
Q123: An economic theory requires,among other things,<br>A)a set