Multiple Choice
Use the figure below to answer the following question.
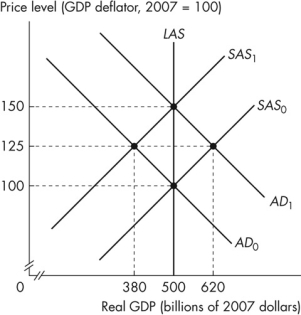 Figure 12.2.1
-Refer to Figure 12.2.1.The figure illustrates an economy initially in equilibrium at the intersection of the SAS0 curve and the AD0 curve.Which of the following shifts the short- run aggregate supply curve from SAS0 to SAS1?
A) an increase in the demand for money
B) a decrease in the money wage rate
C) an increase in the marginal product of labour
D) an increase in the price level
E) an increase in the price of oil
Correct Answer:

Verified
Correct Answer:
Verified
Q37: _ states that the main source of
Q38: An unanticipated deflation does all of the
Q39: Use the table below to answer the
Q40: If the inflation rate is lower than
Q41: If the natural unemployment rate falls<br>A)the short-
Q43: Suppose the quantity of money is expected
Q44: Use the table below to answer the
Q45: According to mainstream business cycle theory, _
Q46: At full employment, an increase in the
Q47: Use the figure below to answer the