Multiple Choice
Use the figure below to answer the following questions.
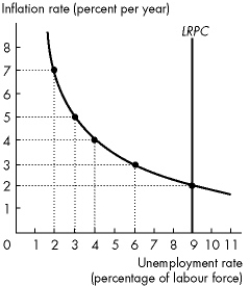 Figure 12.4.1
-Refer to Figure 12.4.1.The figure illustrates an economy's Phillips curves.What is the expected inflation rate?
A) 9 percent a year
B) 4 percent a year
C) 7 percent a year
D) 2 percent a year
E) cannot be determined without more information
Correct Answer:

Verified
Correct Answer:
Verified
Q42: Use the figure below to answer the
Q43: Suppose the quantity of money is expected
Q44: Use the table below to answer the
Q45: According to mainstream business cycle theory, _
Q46: At full employment, an increase in the
Q48: In new classical cycle theory, _ bring
Q49: Use the figure below to answer the
Q50: Inflation that starts because aggregate demand increases
Q51: Deflation is<br>A)a persistent and ongoing falling price
Q52: Use the information below to answer the