Multiple Choice
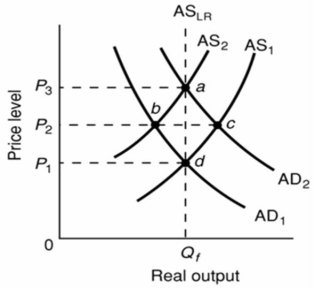 Refer to the above diagram.The initial aggregate demand curve is AD1 and the initial aggregate supply curve is AS1.In the long run, demand-pull inflation is best shown as:
A) a shift of aggregate demand from AD1 to AD2 followed by a shift of aggregate supply from AS1 to AS2.
B) a move from d to b to a.
C) a shift of aggregate supply from AS1 to AS2 followed by a shift of aggregate demand from AD1 to AD2.
D) a move from a to d.
Correct Answer:

Verified
Correct Answer:
Verified
Q2: The long-run aggregate supply curve is vertical:<br>A)because
Q3: In the short run, demand-pull inflation will
Q3: One policy dilemma posed by cost-push inflation
Q4: Long-run equilibrium occurs where:<br>A)real output is greater
Q5: <img src="https://d2lvgg3v3hfg70.cloudfront.net/TB6686/.jpg" alt=" Refer to the
Q6: Using Image 16.1 Global Perspective, which of
Q7: <img src="https://d2lvgg3v3hfg70.cloudfront.net/TB6686/.jpg" alt=" Refer to the
Q7: An adverse aggregate supply shock could result
Q8: <img src="https://d2lvgg3v3hfg70.cloudfront.net/TB6686/.jpg" alt=" Refer to the
Q9: The long-run Phillips Curve is vertical at