Multiple Choice
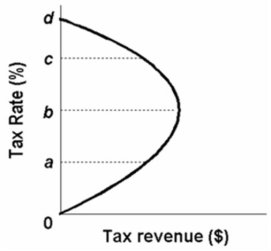 The above diagram describes the notion that as tax:
A) revenues increase from zero to 100 percent, tax rates will increase from zero to some maximum level and then decline to zero.
B) rates increase from zero to 100 percent, tax revenue will increase from zero to some maximum level and decline to zero.
C) rates decrease from 100 to zero percent, tax revenue will decrease from 100 percent to a maximum level.
D) rates increase from zero to 100 percent, tax revenue will increase from zero to a maximum level.
Correct Answer:

Verified
Correct Answer:
Verified
Q58: If government uses its stabilization policies to
Q84: If the government attempts to maintain full
Q85: When the economy is experiencing cost-push inflation,
Q86: A rightward shift of The Phillips Curve
Q87: <img src="https://d2lvgg3v3hfg70.cloudfront.net/TB6686/.jpg" alt=" Refer to the
Q88: If prices and wages are flexible, a
Q91: An ongoing economic growth causes continuous leftward
Q92: Assuming prices and wages are flexible, a
Q93: <img src="https://d2lvgg3v3hfg70.cloudfront.net/TB6686/.jpg" alt=" Refer to the
Q94: With demand-pull inflation in the long-run AD-AS