Multiple Choice
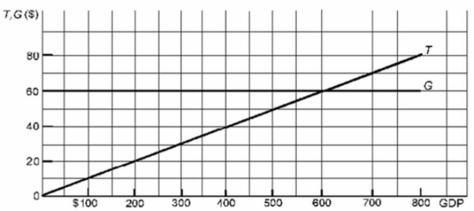 Refer to the above diagram where T is tax revenues and G is government expenditures.All figures are in billions of dollars.If the full-employment GDP is $400 billion while the actual GDP is $200 billion, the actual budget deficit is:
A) $200 billion.
B) $20 billion.
C) $40 billion.
D) $60 billion.
Correct Answer:

Verified
Correct Answer:
Verified
Q126: An appropriate fiscal policy for severe demand-pull
Q186: As a percent of GDP, Canada's public
Q187: <img src="https://d2lvgg3v3hfg70.cloudfront.net/TB6686/.jpg" alt=" Refer to the
Q188: An increase in taxes would be an
Q189: The greater the progressiveness of the tax
Q191: Other things equal, the stock of capital
Q192: With a regressive tax system, as the
Q193: <img src="https://d2lvgg3v3hfg70.cloudfront.net/TB6686/.jpg" alt=" Refer to the
Q194: The net export effect may partially counteract
Q195: If fiscal policy leads to higher interest