Multiple Choice
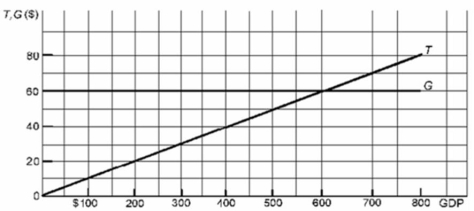 Refer to the above diagram where T is tax revenues and G is government expenditures.All figures are in billions of dollars.If the full-employment GDP is $400 billion while the actual GDP is $200 billion, the full-employment or cyclically adjusted deficit is:
A) $40 billion.
B) zero.
C) $60 billion.
D) $20 billion.
Correct Answer:

Verified
Correct Answer:
Verified
Q177: The greatest expansionary impact of a budget
Q178: Which cause-and-effect chain would best explain the
Q179: The time which elapses between the beginning
Q180: The operational lag of fiscal policy refers
Q181: One reason the public debt will not
Q183: <img src="https://d2lvgg3v3hfg70.cloudfront.net/TB6686/.jpg" alt=" Refer to the
Q184: Who among the following owned the smallest
Q185: <img src="https://d2lvgg3v3hfg70.cloudfront.net/TB6686/.jpg" alt=" Refer to the
Q186: As a percent of GDP, Canada's public
Q187: <img src="https://d2lvgg3v3hfg70.cloudfront.net/TB6686/.jpg" alt=" Refer to the