Multiple Choice
Refer to the supply and demand graph for a public good.Line segment ad represents the amount at Q1 by which the: 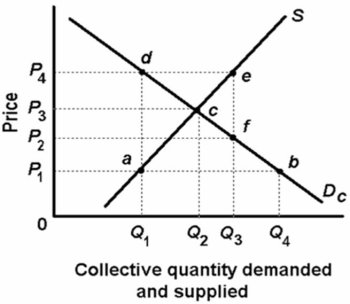
A) marginal benefit of this public good is less than the marginal cost.
B) total benefit of this public good is less than the total cost.
C) marginal benefit of this public good is greater than the marginal cost.
D) total benefit of this public good is greater than the total cost.
Correct Answer:

Verified
Correct Answer:
Verified
Q60: The graphs below refer to two separate
Q61: Answer the next question on the basis
Q62: Refer to the diagrams below in which
Q63: A negative externality or external cost occurs
Q64: A public good:<br>A)is not subject to rivalry
Q66: The following information is for a public
Q68: In which of the following ways does
Q69: With MB<sub>1</sub> and MC<sub>1</sub>, society's optimal amount
Q70: Answer the question based on the following
Q117: Cost-benefit analysis attempts to<br>A)compare the real worth,