Multiple Choice
The graphs below refer to two separate product markets.Assume that society's optimal level of output in each market is Q0 and that government purposely shifts the market supply curve from S to S1 in diagram (a) and from S to S2 in diagram (b) .The shift of the supply curve from S to S2 in diagram (b) might be caused by a per unit: 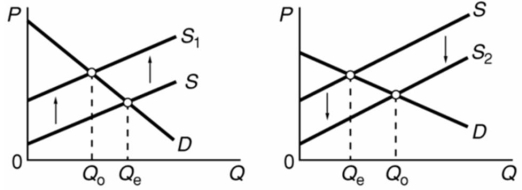
A) subsidy paid to the producers of this product.
B) tax on the producers of this product.
C) subsidy paid to the buyers of this product.
D) tax on the buyers of this product.
Correct Answer:

Verified
Correct Answer:
Verified
Q56: If there are external benefits or positive
Q57: If the price of a product increases:<br>A)the
Q58: Which of the following methods is used
Q61: Answer the next question on the basis
Q62: Refer to the diagrams below in which
Q63: A negative externality or external cost occurs
Q64: A public good:<br>A)is not subject to rivalry
Q65: Refer to the supply and demand graph
Q117: If some activity creates external benefits as
Q221: Cost-benefit analysis is frequently difficult to apply