Essay
Use the graphs below to answer the following questions: 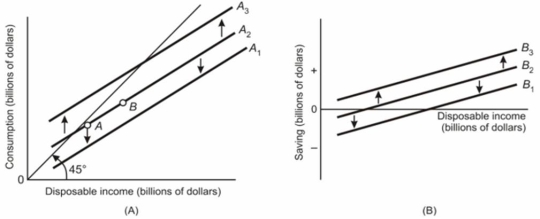 (a) What types of schedules do graphs A and B represent?
(b) If in graph A line A2 shifts to A3 because households consume more and this change is not due to changing taxes, then what would happen to line B2 in graph B?
(c) If in graph B, line B2 shifts to B1 because households save less, then what will happen to line A2 in graph A?
(d) In graph A, what has caused the movement from point A to point B on line A2?
(e) If there is a lump-sum tax increase causing line A2 to shift to A1, then in graph B, what will happen to B2?
Correct Answer:

Verified
(a) Graph A represents the consumption s...View Answer
Unlock this answer now
Get Access to more Verified Answers free of charge
Correct Answer:
Verified
View Answer
Unlock this answer now
Get Access to more Verified Answers free of charge
Q16: Differentiate between the average propensity to consume
Q17: Complete the accompanying table. <img src="https://d2lvgg3v3hfg70.cloudfront.net/TB6686/.jpg" alt="Complete
Q18: Describe the relationship shown by the investment
Q19: Describe the relationship between the Great Recession
Q20: Suppose a family's annual disposable income is
Q21: Define the multiplier.How is it related to
Q22: Most economists regard investment demand as being
Q23: List four factors that could shift the
Q24: Explain the economic impact of an increase
Q26: Explain the difference between a movement along