Multiple Choice
 Refer to the above diagram for a specific economy.The curve on this graph is known as a:
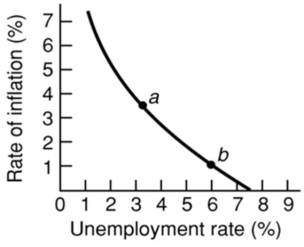
A) Laffer Curve.
B) Phillips Curve.
C) labor demand curve.
D) production possibilities curve.
Correct Answer:

Verified
Correct Answer:
Verified
Q2: The short-run aggregate supply curve shifts to
Q27: Cost-push inflation results directly from a(n):<br>A)decrease in
Q45: The Phillips Curve suggests that, if government
Q55: A shift in the Phillips Curve to
Q64: <img src="https://d2lvgg3v3hfg70.cloudfront.net/TB6686/.jpg" alt=" Refer to the
Q69: <img src="https://d2lvgg3v3hfg70.cloudfront.net/TB6686/.jpg" alt=" Refer to the
Q70: <img src="https://d2lvgg3v3hfg70.cloudfront.net/TB6686/.jpg" alt=" Refer to the
Q72: <img src="https://d2lvgg3v3hfg70.cloudfront.net/TB6686/.jpg" alt=" Refer to the
Q85: When the economy is experiencing cost-push inflation,
Q86: A rightward shift of The Phillips Curve