Multiple Choice
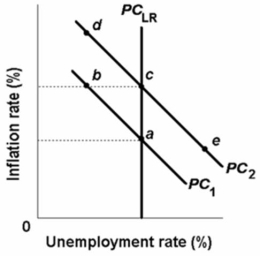 Refer to the above diagram.The move of the economy from c to e on short-run Phillips Curve PC2 would be explained by an:
A) increase in aggregate demand in the economy.
B) increase in aggregate supply in the economy.
C) actual rate of inflation that is less than the expected rate.
D) actual rate of inflation that exceeds the expected rate.
Correct Answer:

Verified
Correct Answer:
Verified
Q20: The short-run aggregate supply curve is upward-sloping
Q45: The Phillips Curve suggests that, if government
Q55: A shift in the Phillips Curve to
Q58: If government uses its stabilization policies to
Q60: In the long-run aggregate demand-aggregate supply model:<br>A)long-run
Q67: <img src="https://d2lvgg3v3hfg70.cloudfront.net/TB6686/.jpg" alt=" Refer to the
Q69: <img src="https://d2lvgg3v3hfg70.cloudfront.net/TB6686/.jpg" alt=" Refer to the
Q70: <img src="https://d2lvgg3v3hfg70.cloudfront.net/TB6686/.jpg" alt=" Refer to the
Q75: <img src="https://d2lvgg3v3hfg70.cloudfront.net/TB6686/.jpg" alt=" Refer to the
Q120: Many economists accept the idea of a