Multiple Choice
 Refer to the above graph.The long-run relationship between the rate of inflation and the unemployment rate is represented by:
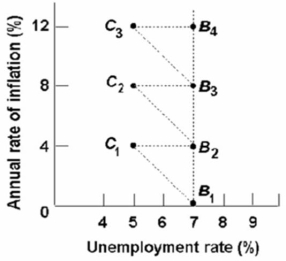
A) the zigzag line connecting points B1, C1, B2, C2, B3, C3, and B4.
B) a line connecting points C1, C2, and C3.
C) a line connecting points B1, B2, B3, and B4.
D) a line connecting points B1 and C1.
Correct Answer:

Verified
Correct Answer:
Verified
Q20: The short-run aggregate supply curve is upward-sloping
Q40: Prominent supply-side economist Arthur Laffer has argued
Q41: The Laffer Curve shows the real world
Q45: The Phillips Curve suggests that, if government
Q58: If government uses its stabilization policies to
Q60: In the long-run aggregate demand-aggregate supply model:<br>A)long-run
Q70: <img src="https://d2lvgg3v3hfg70.cloudfront.net/TB6686/.jpg" alt=" Refer to the
Q72: <img src="https://d2lvgg3v3hfg70.cloudfront.net/TB6686/.jpg" alt=" Refer to the
Q80: <img src="https://d2lvgg3v3hfg70.cloudfront.net/TB6686/.jpg" alt=" Refer to the
Q120: Many economists accept the idea of a