Multiple Choice
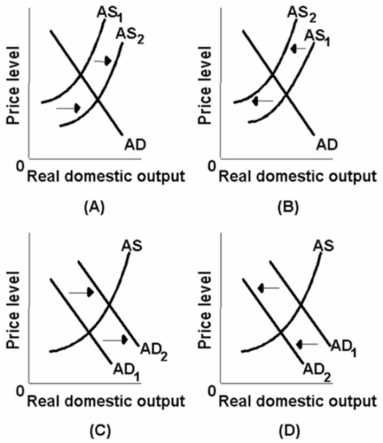 Which of the above diagrams best portrays the effects of a substantial reduction in government spending?
A) A
B) B
C) C
D) D
Correct Answer:

Verified
Correct Answer:
Verified
Related Questions
Q29: Per unit production cost is:<br>A)real output divided
Q51: <img src="https://d2lvgg3v3hfg70.cloudfront.net/TB6686/.jpg" alt=" Which of the
Q54: Refer to the figure given below. <img
Q54: In terms of aggregate supply, in the
Q58: The following table gives information about the
Q66: A change in business taxes and regulation
Q67: In terms of aggregate supply, the short
Q101: A decrease in interest rates caused by
Q115: A decrease in aggregate demand is most
Q158: Productivity is calculated by:<br>A)dividing total output by