Multiple Choice
Refer to the figure given below. 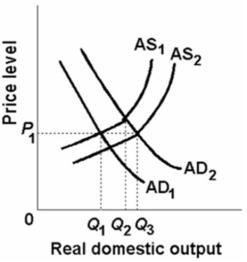 In the above figure, AD1 and AS1 represent the original aggregate demand and aggregate supply curves, respectively.AD2 and AS2 show the new aggregate demand and aggregate supply curves.At the original equilibrium price and quantity, this economy is experiencing:
A) inflation.
B) economic growth.
C) full employment.
D) less than full-capacity output.
Correct Answer:

Verified
Correct Answer:
Verified
Q51: <img src="https://d2lvgg3v3hfg70.cloudfront.net/TB6686/.jpg" alt=" Which of the
Q54: In terms of aggregate supply, in the
Q56: <img src="https://d2lvgg3v3hfg70.cloudfront.net/TB6686/.jpg" alt=" Which of the
Q58: The following table gives information about the
Q64: Which of the factors below best explain
Q66: A change in business taxes and regulation
Q67: In terms of aggregate supply, the short
Q101: A decrease in interest rates caused by
Q115: A decrease in aggregate demand is most
Q189: With output and input prices fixed, the