Multiple Choice
Refer to the diagram given below. 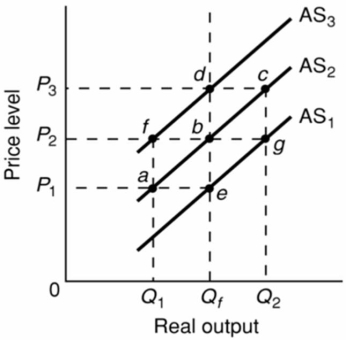 Assume that the nominal wages of workers are initially set on the basis of the price level P2 and that the economy is initially operating at its full-employment level of output Qf.In the long run, demand-pull inflation could best be shown as:
A) a movement from point b to point c on AS2.
B) a movement from point a to point b.
C) a shift of the aggregate supply curve from AS2 to AS1.
D) a movement from point b to point d.
Correct Answer:

Verified
Correct Answer:
Verified
Q6: A decrease in taxes will cause a(n):<br>A)decrease
Q16: Refer to the diagram given below. <img
Q17: Refer to the diagram given below. <img
Q18: Refer to the diagram below.Suppose that aggregate
Q36: The economy experiences a decrease in the
Q70: The interest-rate and real-balances effects are important
Q87: Collective bargaining agreements that prohibit wage cuts
Q91: Suppose higher taxes on businesses cause a
Q113: A fall in real interest rates will
Q132: Other things equal, appreciation of the dollar:<br>A)increases