Multiple Choice
Refer to the diagram given below. 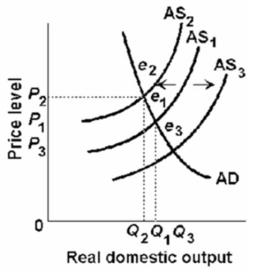 Cost-push inflation can be illustrated by a:
A) shift of the aggregate supply curve from AS1 to AS2.
B) shift of the aggregate supply curve from AS1 to AS3.
C) shift of the aggregate supply curve from AS2 to AS3.
D) movement along the aggregate demand curve from e1 to e3.
Correct Answer:

Verified
Correct Answer:
Verified
Q6: A decrease in taxes will cause a(n):<br>A)decrease
Q13: Suppose the full-employment level of real output
Q17: Refer to the diagram given below. <img
Q18: Refer to the diagram below.Suppose that aggregate
Q19: Refer to the diagram given below. <img
Q91: Suppose higher taxes on businesses cause a
Q113: A fall in real interest rates will
Q132: Other things equal, appreciation of the dollar:<br>A)increases
Q135: A n expected rise in the rate
Q159: An increase in wealth from a substantial