menu-iconExamlexExamLexServices

Discover

Ask a Question
  1. All Topics
  2. Topic
    Business
  3. Study Set
    Macroeconomics Study Set 43
  4. Exam
    Exam 12: Part B: Aggregate Demand and Aggregate Supply
  5. Question
    Refer to the Diagram Below
Solved

Refer to the Diagram Below

Question 1

Question 1

Multiple Choice

Refer to the diagram below. Refer to the diagram below.   A shift of the aggregate demand curve from AD<sub>1</sub> to AD<sub>0</sub> might be caused by a(n) : A) increase in the price level. B) increase in the price of resources. C) increase in investment spending. D) decrease in net export spending. 
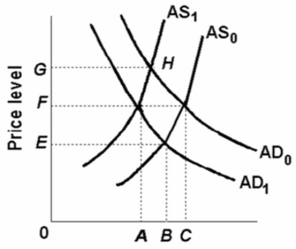
A shift of the aggregate demand curve from AD1 to AD0 might be caused by a(n) :


A) increase in the price level.
B) increase in the price of resources.
C) increase in investment spending.
D) decrease in net export spending.

Correct Answer:

verifed

Verified

Related Questions

Q13: Aggregate demand decreases and real output falls

Q16: Which of the following statements correctly states

Q61: We would expect a decline in personal

Q130: Refer to the information below.Investment spending would

Q143: Suppose that real domestic output in an

Q145: A decrease in government spending will cause

Q152: Which effect best explains the downward slope

Q159: An increase in wealth from a substantial

Q162: The recession that began in 2008 dispelled

Q262: The aggregate expenditures model and the aggregate

Examlex

ExamLex

About UsContact UsPerks CenterHomeschoolingTest Prep

Work With Us

Campus RepresentativeInfluencers

Links

FaqPricingChrome Extension

Download The App

Get App StoreGet Google Play

Policies

Privacy PolicyTerms of ServiceHonor CodeCommunity Guidelines

Scan To Download

qr-code

Copyright © (2025) ExamLex LLC.

Privacy PolicyTerms Of ServiceHonor CodeCommunity Guidelines