Multiple Choice
 Refer to the above diagram.The average propensity to consume:
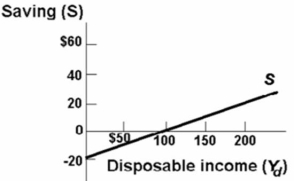
A) is greater than 1 at all levels of disposable income above $100.
B) is greater than 1 at all levels of disposable income below $100.
C) is equal to the average propensity to save.
D) cannot be determined from the information given.
Correct Answer:

Verified
Correct Answer:
Verified
Q4: Assume that for the entire business sector
Q7: Following is consumption schedules for three private
Q25: The investment-demand curve will shift to the
Q46: Dissaving means:<br>A)the same thing as disinvesting.<br>B)that households
Q120: The multiplier effect indicates that:<br>A)a decline in
Q123: Economists disagree on the actual size of
Q128: Suppose that the level of GDP increased
Q152: The reverse wealth effect will tend to
Q181: The investment demand curve of an economy
Q190: The department of finance estimates that the