Multiple Choice
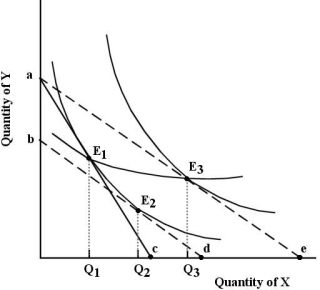 FIGURE 6- 10
-Refer to Figure 6- 10. The line joining points E1 and E3 is known as , which shows how
.
A) an income consumption line; consumption changes as income changes, with relative prices held constant
B) a price consumption line; consumption changes as one price changes, with money income held constant
C) a price consumption line; consumption changes as money income and relative prices change
D) an income consumption line; consumption changes with changing relative prices and constant income
Correct Answer:

Verified
Correct Answer:
Verified
Q19: Assume a person reveals the following demand
Q20: Utility<br>A) can be measured with the appropriate
Q21: <img src="https://d2lvgg3v3hfg70.cloudfront.net/TB5438/.jpg" alt=" FIGURE 6- 1
Q22: An equal proportional increase in money income
Q23: If money income is reduced by half,
Q25: <img src="https://d2lvgg3v3hfg70.cloudfront.net/TB5438/.jpg" alt=" FIGURE 6- 1
Q26: <img src="https://d2lvgg3v3hfg70.cloudfront.net/TB5438/.jpg" alt=" FIGURE 6- 3
Q27: Suppose a utility- maximizing person consumes only
Q28: Given a particular market demand curve, consumer
Q29: Given a particular consumer's indifference map, the