Multiple Choice
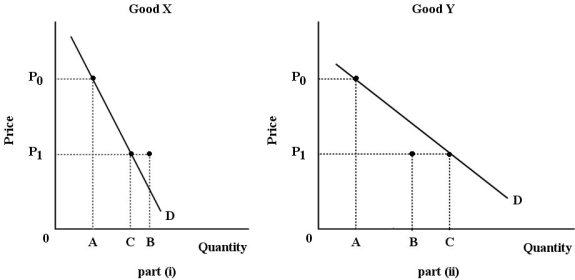 FIGURE 6- 3
-Refer to Figure 6- 3. For both goods, the price falls from P0 to P1. The substitution effect is illustrated by the change in quantity demanded from A to B; the income effect is illustrated by the change in quantity demanded from B to C. Good Y is certainly a(n) good.
A) luxury
B) normal
C) inferior
D) necessity
E) Giffen
Correct Answer:

Verified
Correct Answer:
Verified
Q21: <img src="https://d2lvgg3v3hfg70.cloudfront.net/TB5438/.jpg" alt=" FIGURE 6- 1
Q22: An equal proportional increase in money income
Q23: If money income is reduced by half,
Q24: <img src="https://d2lvgg3v3hfg70.cloudfront.net/TB5438/.jpg" alt=" FIGURE 6- 10
Q25: <img src="https://d2lvgg3v3hfg70.cloudfront.net/TB5438/.jpg" alt=" FIGURE 6- 1
Q27: Suppose a utility- maximizing person consumes only
Q28: Given a particular market demand curve, consumer
Q29: Given a particular consumer's indifference map, the
Q30: As a consumer moves along an indifference
Q31: <img src="https://d2lvgg3v3hfg70.cloudfront.net/TB5438/.jpg" alt=" FIGURE 6- 6