Multiple Choice
The diagram below shows a set of budget lines facing a household. 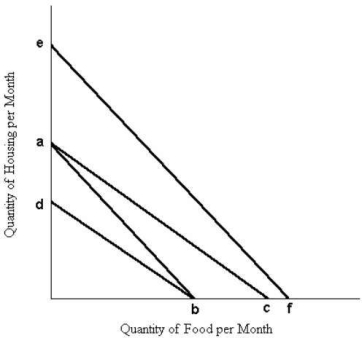 FIGURE 6- 7
-Refer to Figure 6- 7. The movement of the budget line from ab to db could be caused by
A) a decrease in the price of housing.
B) a decrease in the price of food.
C) an increase in the price of housing.
D) an increase in the price of food.
E) a decrease in money income.
Correct Answer:

Verified
Correct Answer:
Verified
Q28: Given a particular market demand curve, consumer
Q28: <img src="https://d2lvgg3v3hfg70.cloudfront.net/TB5441/.jpg" alt=" FIGURE 6-2 -Refer
Q29: Given a particular consumer's indifference map, the
Q30: As a consumer moves along an indifference
Q31: <img src="https://d2lvgg3v3hfg70.cloudfront.net/TB5438/.jpg" alt=" FIGURE 6- 6
Q32: Given a typical downward- sloping demand curve
Q34: The figures below show Chris's consumption of
Q35: The figures below show Chris's consumption of
Q37: Since there is a limited supply of
Q38: <img src="https://d2lvgg3v3hfg70.cloudfront.net/TB5438/.jpg" alt=" FIGURE 6- 2